
- numpy and matplotlib
import numpy as np
import matplotlib.pyplot as pt
x = np.arange(0,360)
y = np.sin(x*np.pi/180)
pt.plot(x,y)
pt.xlim(0,360)
pt.ylim(-2,2)
pt.title("SINE")
pt.show()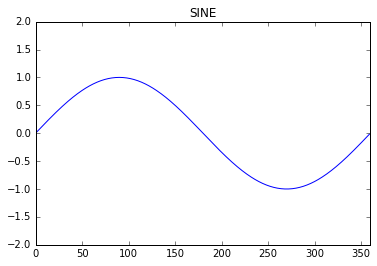
import numpy as np
import matplotlib.pyplot as pt
x = np.arange(0,360)
y = np.sin(x*np.pi/180)
pt.plot(x,y)
pt.xlim(0,360)
pt.ylim(-2,2)
pt.title("SINE")
pt.show()